

Block by block, home after home, a crew of three contractors walks slowly, stopping every few feet to plant a small pink flag into the ground. The flags mark the lids to curb boxes, which provide underground access to the service lines carrying water to each home. Since January, when curb box inspections began in earnest, the crew has been seeking the answer to a simple, yet critical question: How many lead service lines are there in Pittsburgh?
Though the lead test results released Tuesday by the Pittsburgh Water and Sewer Authority do not exceed the federal action limit, the question must still be answered. For one, the 90th-percentile result of 15 ppb is the threshold. Further, the state won’t lift its order to replace at least 7 percent of all lead service lines each year until the city’s water tests at or below the allowable limit for back-to-back rounds of testing.
To determine the scope of work to meet the state requirement, the city needs to develop an inventory of all lead service lines in the city.
The magnitude of this task is difficult to overstate: The PWSA’s historical records are largely incomplete, so the work of counting the service lines must be done manually, one by one.
PWSA plans to complete the inventory in 2021. In the meantime, it’s relying on an estimate produced by an independent contractor.
Officially, PWSA estimates that about 25 percent of city homes have lead service lines; however, the range of estimates PWSA submitted to the Department of Environmental Protection in September ranged from 25 percent (17,758 homes) to 46 percent (32,970 homes). That’s a difference of 15,212 city homes.
Some experts have concerns about how PWSA and those affiliated arrived at the lead service line estimate, and, despite substantial gaps in the data, PWSA has not yet updated its 10-month-old statistical model to include new data gleaned from about 1,750 curb box inspections performed across the city.
The study
In September 2016, the PWSA hired Alexandra Obolensky, a principal at Obolensky Consulting in Philadelphia, to develop a statistical model that would estimate the number of lead service lines in Pittsburgh.
Her study was based on existing data in PWSA’s GIS [geographic information system], which is limited and may contain errors; the agency’s historical paper records; and a case study of 180 homes in Upper Lawrenceville.
The study yielded seven different estimates, each of which differed based on variables such as parcel age or corrections for error rates found in the historical data.
In 2015, PWSA began unrelated work to replace a water main in Upper Lawrenceville. Because they had to dig up the street anyway, PWSA decided to conduct an inventory count and replace all the public-side service lines and use it as a model. Data from phase one of the replacement showed that 49 out of 180 homes, or 27 percent, had lead service lines. Phase two, which was not included in the estimate compiled by Obolensky, found 10 of 149 homes had lead service lines, far below even the most conservative estimates.
Obolensky’s initial model estimate for the city came in at 46 percent. Because the data was limited, it was validated against data from the 180 homes in Upper Lawrenceville. This resulted in a range of lower estimates, the lowest of which came in at 25 percent, or 17,758 homes.

PWSA selected the next highest estimate of 27 percent (though the agency uses 25 percent when talking to the public) and uses it as the basis for how many lead service lines it needs to replace to be in compliance with the state’s order.
When asked why DEP lets PWSA choose one of the lowest estimates on the spectrum, DEP press secretary Neil Shader wrote in an email: “This is part of ongoing discussions with PWSA about LSLs [lead service lines], and I can’t really comment further.”
Michael Blackhurst, a University of Pittsburgh researcher and co-director of Pitt’s Urban and Regional Analysis Program, calls Obolensky’s study “a helpful initial exploration of the data available to her at the time,” but believes uncertainties in the underlying data and the statistical models make it a less-than-ideal foundation for making robust policy decisions.
“The decision to use a relatively small sample from Upper Lawrenceville for model validation appears problematic,” Blackhurst said. “There is no intuitive reason to think that Upper Lawrenceville is representative of citywide land development and construction practices.”
Obolensky said she can’t recall the details about whether or not Upper Lawrenceville was representative of the city as a whole, other than to say: “If there had been any meaningful information about the representativeness (or not) of that area, I would have included it in the report.” This information does not appear to be present in the study.
Blackhurst believes that given the high stakes for public health, the statistical models and data collected should be made available to the public and experts for collaboration and peer review. He notes that the curb box data on PWSA’s GIS site is labeled as “not for any commercial, legal or other use” beyond providing property owners and residents the best available data. That limits Blackhurst and other researchers from analyzing the data.
“In serving municipalities, my experience has been that any important public decision with lots of underlying uncertainty is advanced with a spirit of openness,” wrote Blackhurst in an email to PWSA.
A model partnership could be found in Flint, Michigan. There, the city teamed up with the University of Michigan for a study, funded by Google, to estimate the city’s number of lead service lines. Based on their case study of 159 homes, they concluded that 29,100 homes in Flint, representing 52 percent of the city’s homes, have lead service lines. Less than a year earlier, another University of Michigan study put forth an estimate of 8,000 homes.

Flint officials acknowledge that a larger sample size could better capture the true number of lead service lines; however, they are sticking with the 52 percent estimate due to an “unwillingness during a city public health emergency to disregard any potential residence that might need a lead-tainted service line replaced,” said Ret. Brig. Gen. Michael McDaniel, who is leading the effort to replace lead lines in Flint.
Nevertheless, Flint has pledged to remove 6,000 lead service lines annually until all have been replaced. The progress can be viewed and tracked online.
Once PWSA gets under the EPA limit for lead, an agency spokesman says they do not plan to continue replacing 7 percent of lead lines annually; instead, they will replace associated lead lines as they replace water mains.
“From our perspective, if we were to come under the action level, that would be a more responsible approach to replacing lines,” spokesman Will Pickering said. It doesn’t make sense to replace a service line attached to a brittle water main, Pickering explained, also mentioning the cost of replacing 7 percent each year as another reason.
Pickering says the industry standard for replacing water mains is 1 percent annually. He says PWSA is currently below that rate, though they hope to increase replacements as part of future capital improvement projects.
“There are parts of the system that are more than 100 years old, so replacing the mains as well as lead service lines that feed into them will provide the best long-term water quality,” wrote Tim McNulty, communications director for Mayor Bill Peduto.
Preliminary data
Seven months into the PWSA’s curb box inspection program, results from 1,504 curb box inspections are available online. The city also uploaded the results of 245 other curb box inspections that occurred outside of the program. PublicSource analyzed the available online data and here are three main takeaways:
- PWSA’s calculation of lead lines found so far is misleading. PWSA displays that 19 percent of homes inspected so far have lead on the public side of the service line. But PWSA biases the data by dividing the number of homes with lead (290 homes) by the total number of homes inspected (1,504 homes), including even those that came back as undetermined. Its calculation also doesn’t include the 245 other curb box inspection results.
- The concerning part is that the number of undetermined lines make up the majority; 58 percent of curb box inspections came back as unknown (about 61 percent if you include the other inspections). The pipe material either couldn’t be determined on site or the pipe was inaccessible or couldn’t be located. But for statistical purposes, PWSA counts them as not having lead.
- When you take out the unknowns and count all available data, the percentage of lead service lines found by inspectors so far appears much higher. We considered only homes where a clear determination of lead or not lead could be made: 323 lead lines represent 47.3 percent of homes with lead on the public side; 360 homes, or 52.7 percent, inspected did not have lead.
These calculations include only the public side of the service line, though the curb box inspection data also indicates the composition of the private side line. Therefore, any home that has lead on the private side and not the public side is not currently included in PWSA’s count.
“We’ve tried to be clear from the outset that the data shared online is dynamic and represent the preliminary results of our program,” Pickering wrote in an email.
Premature calculation
PWSA considers the 1,504 inspections conducted since launching its curb box program in January, not including 245 other inspections prompted by request or a high lead test result. The agency’s calculation shows 19 percent of public lead lines inspected so far have been identified as lead. It’s a misleading result because PWSA counted the unknown service lines in the non-lead category.
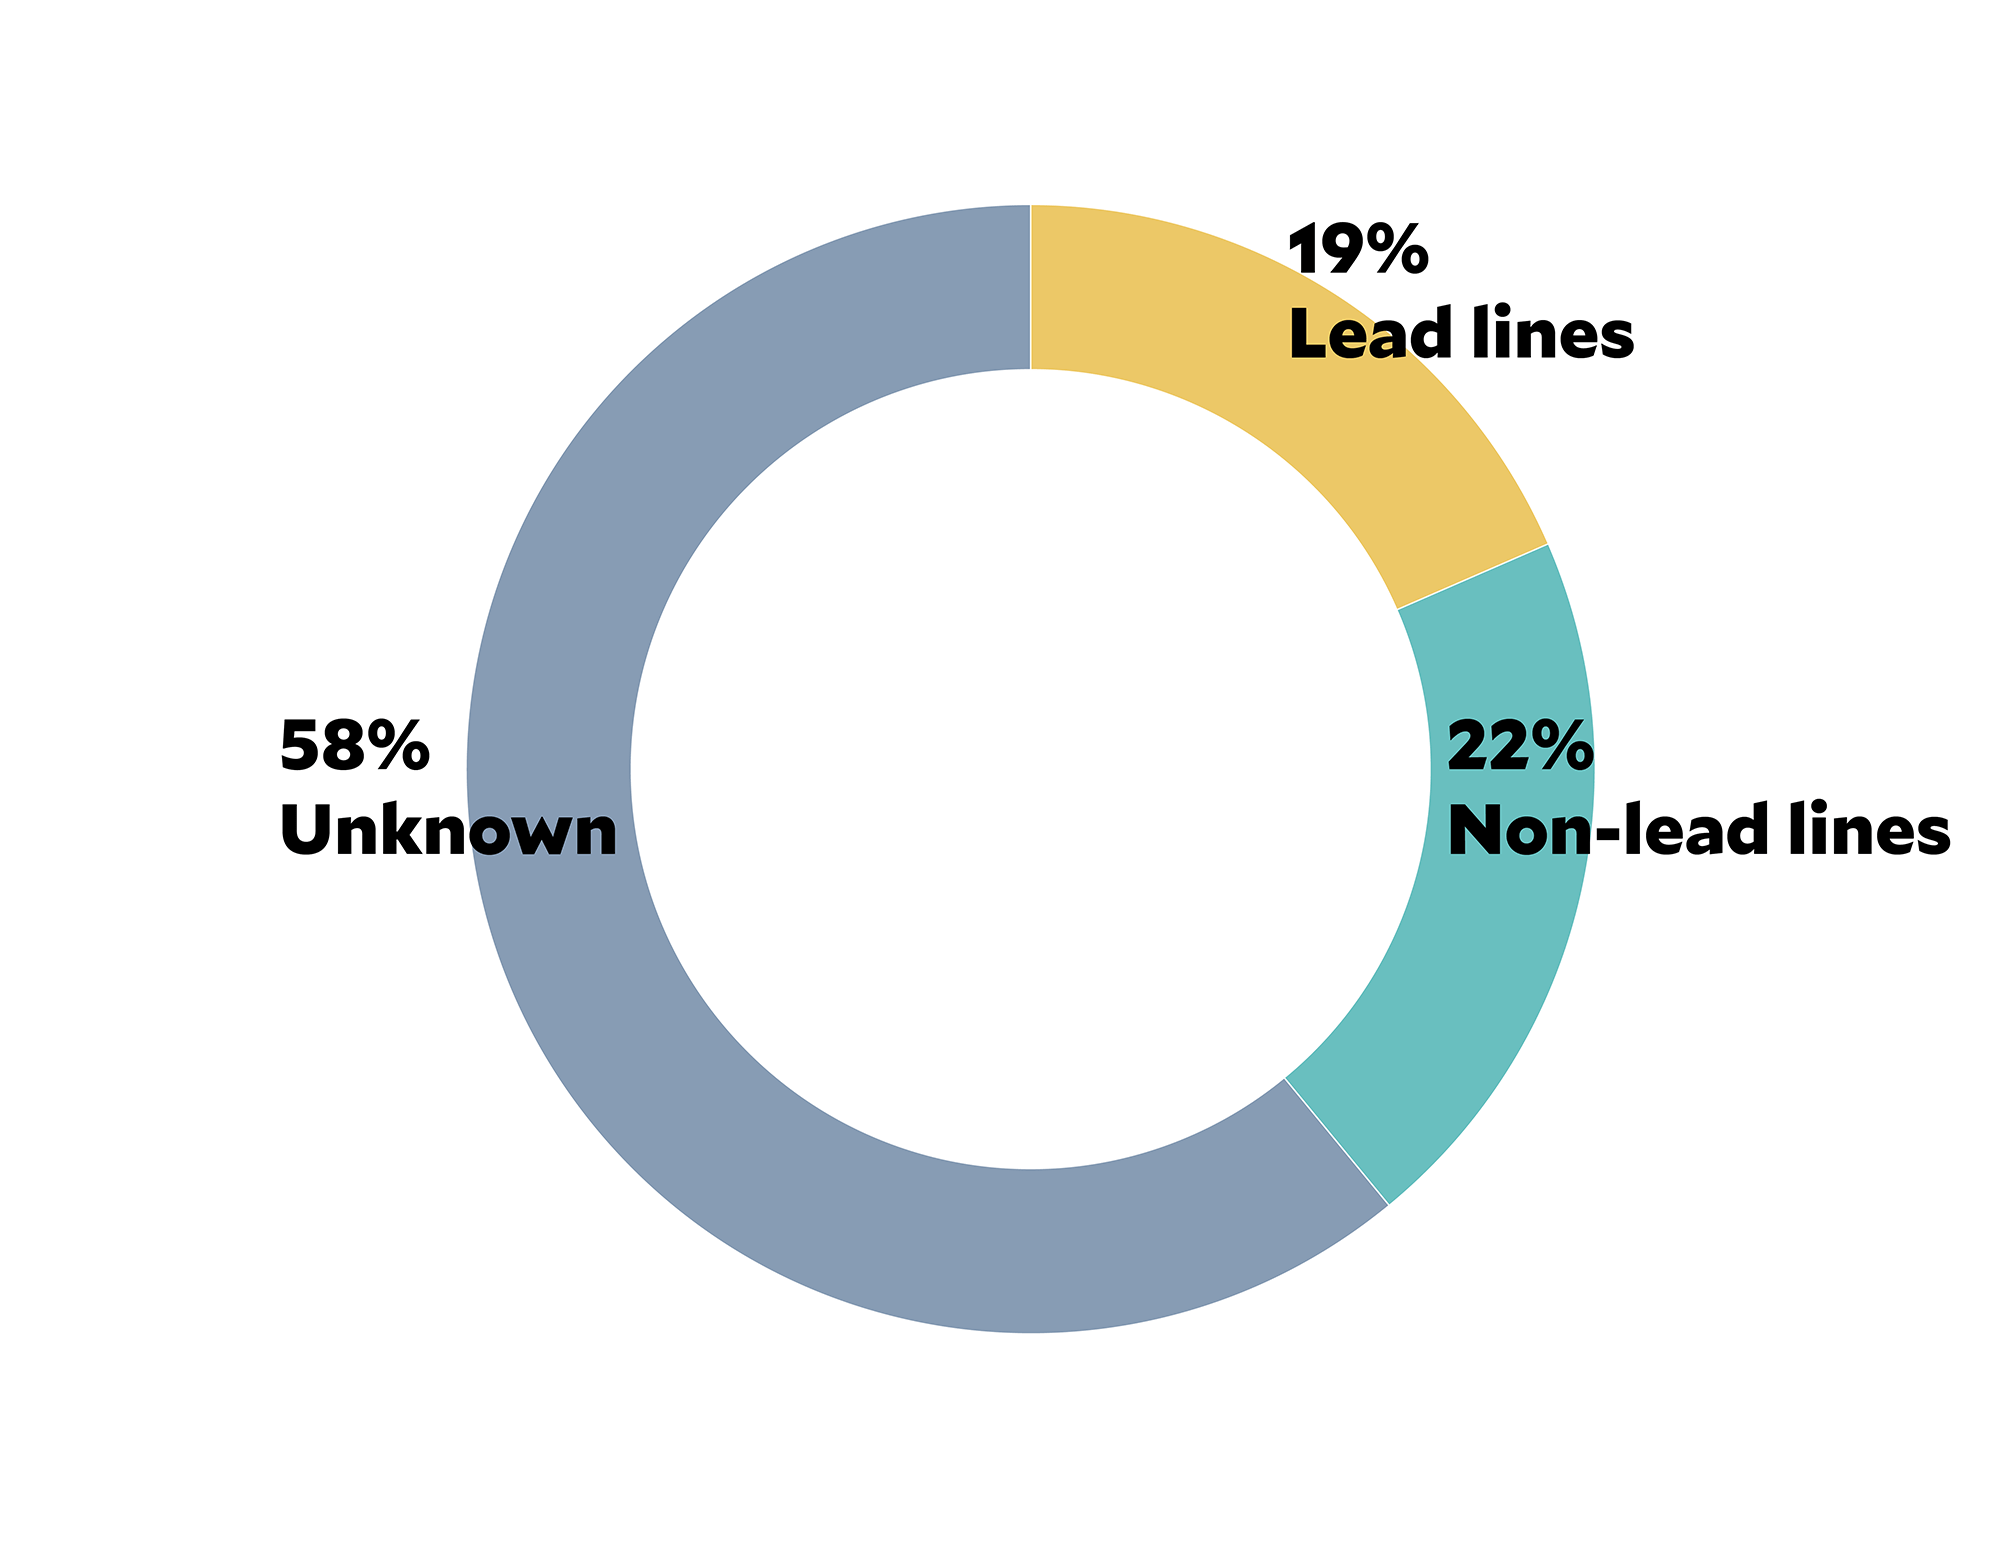
Note: “Unknown” includes lines that the Pennsylvania Water and Sewer Authority (PWSA) considered undetermined, not accessible or couldn’t be located. Those lines will undergo further analysis to determine the material. Figures were rounded and do not add to 100 percent. Source: PWSA
Clear determination
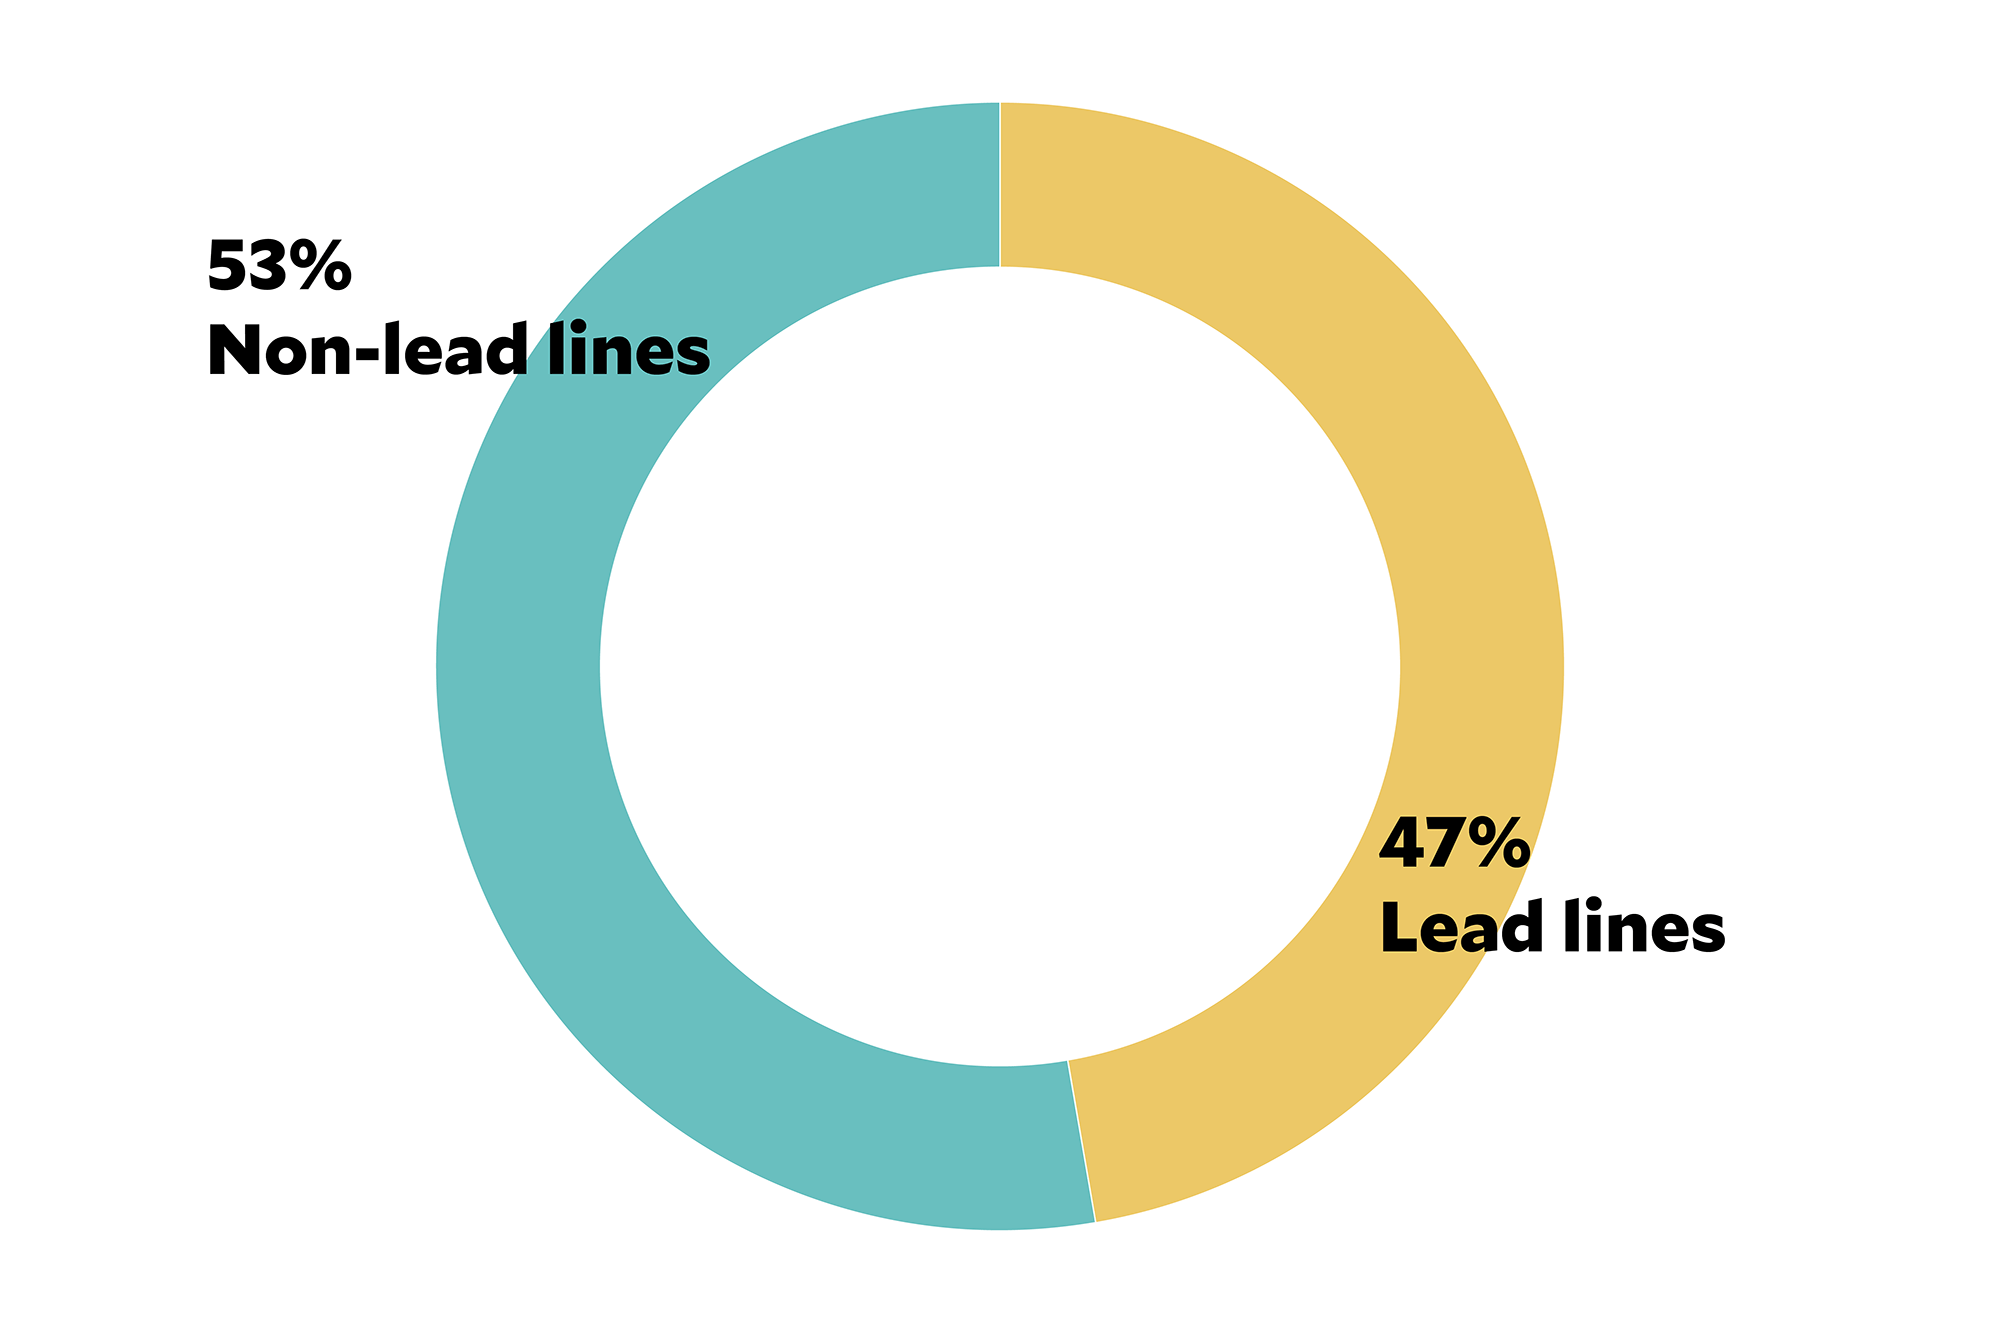
When you consider only homes where inspectors could definitively identify lead or not, the percentage of lead service lines on the public side appears much higher than how PWSA calculates on its GIS site. PublicSource also included results of 245 curb box inspections that occurred outside of the official program.
Source: PublicSource analysis of PWSA curb box inspection data
Meanwhile, legislation proposed by Peduto’s office that would allow the city to replace the private lines in conjunction with the public lines has been tabled for weeks. State Sen. Wayne Fontana’s bills in Harrisburg seeking the same are moving through the House, but have been forced to take a backseat until the state has a budget.
Sarah Bolenbaugh, a senior engineer with Mott McDonald and part of the PWSA program management team for its curb box program, warns against drawing too many conclusions from the preliminary data. She says PWSA chose to begin curb box inspections on a rotating basis by council district and that PWSA is “trying to find the areas with the highest density of lead. …But everywhere in Pittsburgh is old.”
In PWSA’s current lead program summary, it says these pockets of homes were chosen based on “parcel age, water main age, historical records, and lead test data.”
In a 2016 letter from then-Executive Director Bernie Lindstrom to the DEP, Lindstrom wrote that PWSA plans to update its statistical models on a quarterly basis and submit the new estimate to the DEP for review.
Ten months later, they have not updated the model, nor do they have current plans to update it.
Check back tomorrow for a story on what Pittsburghers can expect from the curb box inspections for lead service lines.
Brian Conway is a Pittsburgh-based freelance writer. He can be reached at brian.conway@gmail.com.


